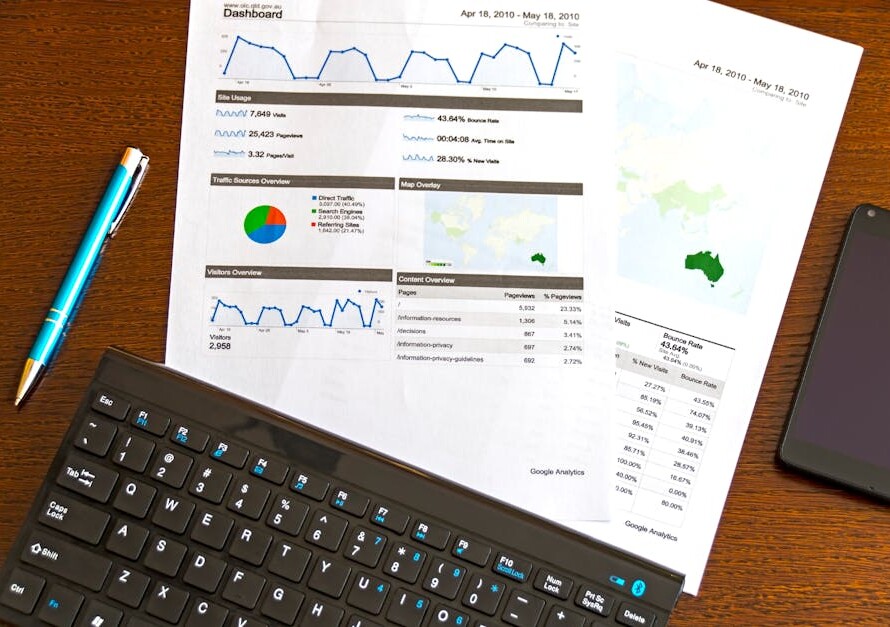
The Power of Business Dashboards
For small business owners, the term business dashboards might sound technical and overwhelming. But it need not be. In simple terms, business dashboards are visual tools that simplify data analysis, making it easier to monitor and manage your business effectively.
Quick Benefits of Business Dashboards:
– Centralized View of Data: Access all important metrics in one place.
– Real-Time Updates: Stay on top of your business with up-to-date information.
– Improved Decision-Making: Gain insights that guide strategic choices.
– Time-Saving: Automate data updates, freeing up time for analysis and strategy.
Business dashboards are not just fancy displays; they are critical tools that provide a snapshot of your business health. Imagine having a dashboard that displays your sales numbers, customer feedback, and marketing performance—all in one view. This holistic perspective enables you to make better, quicker decisions that drive your business forward.
I’m Russell Rosario, the co-founder of Profit Leap. With expertise as a Chief Financial Officer and a software engineer, I specialize in creating business dashboards that explain data for small business owners. Let’s dive deeper into how business dashboards can transform your operations.

What Are Business Dashboards?
Business dashboards are tools that display critical data in a visually appealing way. They help businesses track, analyze, and make decisions based on key performance indicators (KPIs) and other vital metrics.
Definition
A business dashboard is a data visualization and analysis tool. It shows the status of KPIs and other important business metrics on one screen. Think of it as your business’s control center. It gives you a quick, at-a-glance view of your company’s health and performance.
Purpose
The main purpose of a business dashboard is to simplify complex data. By changing raw data into visual elements like graphs and charts, dashboards make it easier for you to understand and act on the information. This helps in:
- Monitoring performance
- Identifying trends
- Making data-driven decisions
- Improving communication across teams
Types of Business Dashboards
There are three primary types of business dashboards, each serving a unique purpose:
-
Strategic Dashboards: These are used by executives to monitor long-term company strategies. They focus on high-level metrics and overall business health.
-
Analytical Dashboards: These are used for deep data analysis. They help teams understand trends, patterns, and correlations over time.
-
Operational Dashboards: These focus on real-time data and daily operations. They help teams track the status of KPIs and make quick decisions.
Key Performance Indicators (KPIs)
KPIs are the backbone of any business dashboard. They are specific, measurable values that show how effectively a company is achieving its key business objectives. Examples include:
- Sales Revenue
- Customer Satisfaction Score
- Net Profit Margin
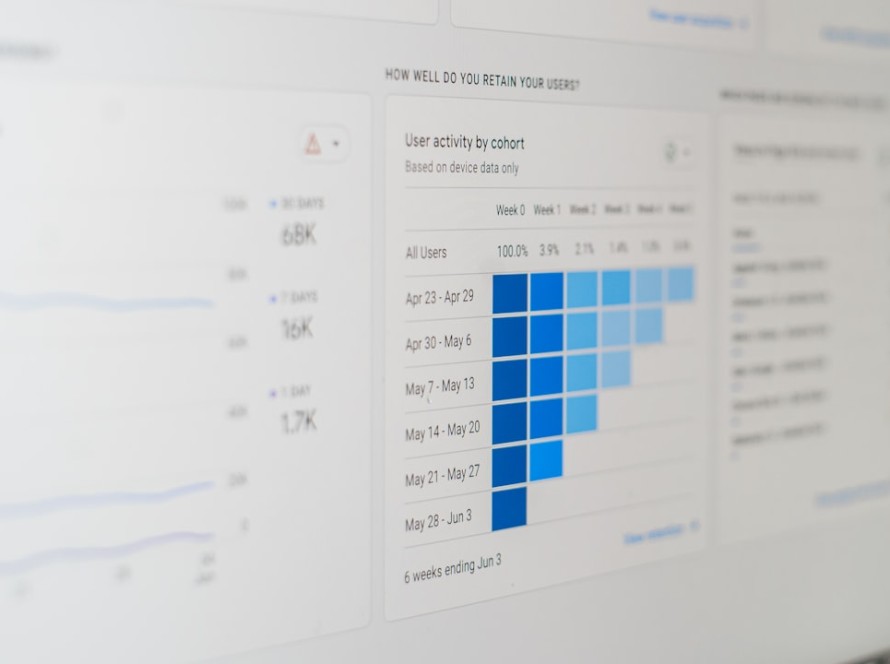
Data Visualization
Data visualization is crucial for making dashboards effective. It involves using visual elements like charts and graphs to represent data. Here are a few common types of visualizations:
- Line Charts: Great for showing trends over time.

- Bar Charts: Useful for comparing different items in the same category.

Using the right type of chart is essential. It ensures that the data is easy to understand and actionable.
In summary, business dashboards turn complex data into simple, visual insights. They help you monitor performance, make informed decisions, and keep your business on track.
Next, we’ll explore the benefits of business dashboards and how they can drive your business forward.
Types of Business Dashboards
Business dashboards come in different types, each designed for specific purposes. Let’s break down the three primary types: analytical dashboards, operational dashboards, and strategic dashboards.
Analytical Dashboards
Analytical dashboards are your go-to for in-depth analysis. They help you understand trends, patterns, and the relationships between different data points over time. Think of them as the detective of dashboards, digging deep to uncover insights.
Example: Imagine you manage a retail store. An analytical dashboard can show you sales trends over the past year, helping you identify peak seasons and products that perform best. This insight can guide your inventory and marketing strategies.
Key Features:
– Trend Analysis: Track changes over days, weeks, months, or years.
– Complex Data: Handle detailed and multi-variate data.
– Deep Insights: Provide thorough analysis to inform strategic decisions.
Operational Dashboards
Operational dashboards are all about real-time monitoring. They focus on the day-to-day operations and key performance indicators (KPIs) that keep your business running smoothly. Think of them as the heartbeat monitor of your business.
Example: In a customer service department, an operational dashboard can show real-time metrics like the number of open tickets, average response time, and customer satisfaction scores. This helps managers address issues as they arise.
Key Features:
– Real-Time Data: Provide up-to-the-minute information.
– Specific KPIs: Focus on key metrics that indicate operational health.
– Simplicity: Often less complex, showing only the most crucial data.
Strategic Dashboards
Strategic dashboards give a high-level overview of your business’s health and performance. They are designed for executives and senior managers who need to make long-term decisions. Think of them as the compass guiding your business’s future direction.
Example: A strategic dashboard for a CEO might include metrics like overall revenue growth, market share, and employee turnover rates. This data helps in making decisions about expansion, investments, and overall strategy.
Key Features:
– High-Level Metrics: Aggregate data to show overall performance.
– Long-Term Focus: Aid in strategic planning and goal setting.
– Simplified Data: Present data in an easy-to-understand format for quick insights.
In conclusion, business dashboards are versatile tools that can cater to different needs, from detailed analysis to real-time monitoring and strategic planning. Choosing the right type of dashboard depends on what you aim to achieve and who will use it.
Next, let’s dive into the benefits of business dashboards and how they can drive your business forward.
Benefits of Business Dashboards
Business dashboards are not just fancy charts and graphs. They are powerful tools that can transform how you manage and grow your business. Let’s look at some of the key benefits they offer.
Centralized View
Dashboards bring all your important data into one place. Imagine having sales figures, customer feedback, and inventory levels all displayed on a single screen. This centralized view helps you see the big picture without jumping between different systems.
For example, a marketing agency might use a dashboard to track metrics like cost-per-click (CPC) and return on investment (ROI). By having all this data in one place, they can quickly adjust their strategies to maximize campaign performance.
Real-Time Access
One of the biggest advantages of business dashboards is real-time access to data. This means you can see up-to-date information whenever you need it. No more waiting for monthly reports or manually updating spreadsheets.
For instance, a retail store can monitor daily sales and stock levels. If a product is selling out fast, they can restock it immediately. This agility keeps your business running smoothly and helps you respond to changes quickly.
Improved Communication
Dashboards improve communication within your team. When everyone has access to the same data, it’s easier to stay on the same page. You can discuss insights and make decisions based on the same information.
Louis-Dominic Parizeau, Director of Adviso, emphasizes that dashboards summarize information in a way that’s easy to understand, helping decision-makers focus on what’s important.
Decision-Making
Making informed decisions is easier with business dashboards. They highlight trends, flag issues, and show key performance indicators (KPIs). This helps you take action immediately.
A well-designed dashboard can answer questions like “How well are we doing?” and “What do we do next?” By providing clear, actionable insights, dashboards guide your decision-making process.
Collaboration
Dashboards foster collaboration by providing a common understanding of business goals and priorities. Team members can easily share insights and work together to solve problems.
For example, if sales are dropping, the sales and marketing teams can use the dashboard to identify problem areas and brainstorm solutions. This collaborative approach leads to more effective strategies and better results.
Dashboards are more than just data displays; they are essential tools that can help you understand and run your business more effectively. Next, we’ll explore how to create effective business dashboards that meet your specific needs.
How to Create Effective Business Dashboards
Creating effective business dashboards involves careful planning and execution. Here’s a step-by-step guide to ensure your dashboards are both functional and impactful:
Goal Setting
Define Clear Objectives: Start by identifying what you want to achieve with your dashboard. Is it for tracking sales performance, monitoring customer satisfaction, or optimizing operational efficiency? Clear goals will guide the design and functionality of your dashboard.
“Every dashboard you create should exist for a focused user group with the specific aim of helping users tap into business decision-making processes,” notes RIB Software.
Relevant Metrics
Choose Actionable KPIs: Select Key Performance Indicators (KPIs) that align with your goals. Metrics should be specific, measurable, and actionable. For example, if your goal is to improve customer service, track metrics like response time and customer satisfaction scores.
Understand Your Audience: Tailor metrics to the needs of your audience. Executives might need high-level KPIs, while department managers require more granular data.
Data Sources
Identify and Integrate Data Sources: Determine where your data will come from. This could include CRM systems, financial software, or marketing tools. Ensure you have access to all relevant data to build a comprehensive dashboard.
Centralized Data: A business dashboard simplifies how you gather, analyze, and interpret data by connecting various data sources. This eliminates the need for manual data exports and formatting.
Visual Elements
Use the Right Visualization Tools: Different data types are best represented in different ways. Sales trends might be best shown in a line graph, while market share could be better displayed in a pie chart. Choose visual elements that make the data easy to understand.
Tell a Story with Your Data: Present data in a way that tells a story. Effective storytelling can bridge the gap between technical users and those less familiar with analytics. Plan what charts to include based on your audience and goals.
Interactivity
Interactive Features: Ensure the dashboard is interactive. Users should be able to filter data, drill down into details, and customize views. This makes the dashboard more user-friendly and allows for deeper data exploration.
Responsiveness: Make sure your dashboard adapts seamlessly to different screen sizes and devices. This improves accessibility and usability.
Security
Access Controls: Implement strict access controls to ensure that only authorized personnel can view or modify the dashboard. This protects sensitive business data.
Data Protection: Use encryption and other data protection measures to safeguard your data from cyberattacks. Regularly update your security protocols to address new threats.
Timeliness: Keep your data up-to-date. Outdated data can lead to poor decision-making. Ensure your KPIs reflect current trends and challenges.
By following these steps, you can create effective business dashboards that turn raw data into actionable insights. Next, we’ll discuss the best practices for business dashboard design, ensuring your dashboards are both visually appealing and highly functional.
Best Practices for Business Dashboard Design
Creating effective business dashboards requires more than just placing charts and graphs on a screen. Here are some best practices to follow:
Chart Selection
Choose the right chart for the right data. Bar charts are great for comparing categories, while line charts excel at showing trends over time. Pie charts can be useful for showing proportions but use them sparingly to avoid clutter.
Color Consistency
Stick to a limited color palette. Use two to three colors consistently to avoid overwhelming the user. For example, use green for positive trends and red for negative ones. This helps users quickly understand the data.
Simplicity
Keep it simple. Avoid adding unnecessary elements that can distract from the main message. Focus on the key metrics that matter most to your business.
Avoiding Clutter
Less is more. Too many graphs and charts can confuse users. Prioritize the most important data and remove the rest. A clean dashboard is easier to read and more effective.
Audience Consideration
Know your audience. Tailor your dashboard to meet the needs of the end-users. If it’s for executives, focus on high-level metrics. For operational teams, include more detailed data.
Text Usage
Use text sparingly. Labels and legends should be clear and concise. Avoid long descriptions that can clutter the dashboard.
Customization
Allow for customization. Users should be able to filter data and adjust views to meet their specific needs. This makes the dashboard more interactive and useful.
Mobile Optimization
Design for mobile. Ensure your dashboard is responsive and looks good on smaller screens. This means focusing on the most critical visuals and making buttons easy to tap.
Graphical Integrity
Maintain graphical integrity. Represent data truthfully and avoid misleading visuals. The scale and proportions should reflect the actual data accurately.
By following these best practices, you can create business dashboards that are not only visually appealing but also highly functional. Next, we’ll explore the features of a good business dashboard software, ensuring you have the right tools to create effective dashboards.
Features of a Good Business Dashboard Software
Creating effective business dashboards requires the right software. Here are the key features to look for:
Global Styling
Consistency is key. Good software allows you to apply global styling to ensure a unified look across all your dashboards. This includes setting fonts, colors, and other visual elements that match your brand. A cohesive style makes your dashboards look professional and easy to understand.
Reporting Components
A robust dashboard software includes various reporting components like charts, tables, and gauges. These components help visualize data in different ways, making it easier to interpret. Look for software that offers a wide range of visualization options to suit different types of data and analysis.
Interactivity
Interactivity is crucial for exploring data. Features like drill-downs, filters, and clickable elements allow users to dive deeper into the data. This encourages exploration and helps uncover insights that might not be immediately obvious.
Sharing and Embedding
Sharing insights is essential for collaboration. Good dashboard software should offer easy sharing and embedding options. This means you can share dashboards via email, links, or even embed them in other applications. This makes it easier for your team to access and use the data.
Export Options
Sometimes, you need a static version of your dashboard. Export options allow you to save dashboards as PDFs, images, or Excel files. This is useful for presentations or when sharing with stakeholders who prefer offline access.
Device Accessibility
In today’s mobile world, device accessibility is a must. Ensure the software supports access from smartphones and tablets. This allows users to check dashboards on the go, making real-time decision-making possible.
By choosing software with these features, you’ll be well-equipped to create effective and engaging business dashboards. Next, let’s tackle some common questions about business dashboards to deepen your understanding.
Frequently Asked Questions about Business Dashboards
What are the key components of a business dashboard?
Key Performance Indicators (KPIs): KPIs are the backbone of any business dashboard. They provide measurable values that show how effectively a company is achieving key business objectives. Examples include sales revenue, customer satisfaction scores, and net profit margins.
Performance Reports: These reports offer detailed breakdowns of various business activities. They help track progress and identify areas for improvement.
User Interface: A clean, intuitive interface is crucial. It should be easy to steer so users can quickly find the information they need.
Real-Time Updates: Dashboards should be updated in real-time to provide the most current data. This ensures decisions are based on the latest information.
Comparative Analysis: This feature allows users to compare different time periods, regions, or product lines. It helps in understanding trends and making informed decisions.
Customization: Every business is unique, and so are its needs. Customizable dashboards allow users to tailor the layout, metrics, and reports to fit their specific requirements.
How do business dashboards improve decision-making?
Data Consolidation: Business dashboards bring data from various sources into one place. This makes it easier to see the big picture and make informed decisions.
Trend Analysis: By visualizing data over time, dashboards help identify trends. This can highlight areas of growth or concern, guiding strategic planning.
Real-Time Insights: With real-time data, businesses can react quickly to changes. Whether it’s a sudden drop in sales or a spike in customer complaints, immediate action can be taken.
Collaboration: Dashboards can be shared easily among team members. This fosters a collaborative environment where everyone is on the same page, working towards common goals.
What are the security considerations for business dashboards?
Access Controls: It’s vital to control who can view and edit the dashboard. Role-based access ensures that sensitive information is only accessible to authorized personnel.
Data Protection: Protecting data from breaches is crucial. Encryption and secure data storage practices help safeguard sensitive information.
Cyberattack Prevention: Regular security audits and updates can prevent cyberattacks. Using firewalls, antivirus software, and other security measures adds an extra layer of protection.
By addressing these security considerations, you can ensure that your business dashboards are both effective and safe to use.
Conclusion
At Profit Leap, we understand the transformative power of business dashboards. They are not just tools; they are essential for driving your business forward. Our commitment is to provide you with the best tools and insights to make data-driven decisions that lead to success.
Huxley AI: Your Business Co-Pilot
Meet Huxley AI, our pioneering AI business advisor. Huxley is designed to be more than just a dashboard tool. It’s your business’s co-pilot, providing custom advice, precise forecasting, and actionable insights. Imagine having a consultant that understands your business inside out and offers personalized recommendations to optimize your strategies.
Custom Insights for Small Business Owners
Small business owners face unique challenges. Limited resources and the need for quick, effective decision-making can be daunting. Huxley addresses these challenges by providing insights that are not just accurate but also easy to understand and act upon. This ensures you are not just reacting to changes but creating them.
Michael Solis from TransRide is a great example. He turned his struggling business around in just a couple of months after implementing Huxley’s sales forecasting and management tool. This is the kind of real-world impact Huxley can have on your business.
Your Partner in Success
The future of business is about more than just keeping up with changes; it’s about leading them. At Profit Leap, we are committed to being your partner in this journey. Our blend of artificial and human intelligence ensures your business is equipped to meet today’s challenges and innovate for tomorrow.
By choosing Profit Leap, you’re not just getting an AI business advisor; you’re gaining a partner dedicated to your sustained success. Let Huxley be the compass that guides your business through the ever-changing landscape towards unparalleled success.
Ready to take the leap? Work with us and let Profit Leap be your guide to a brighter business future.